


Exploring Personal Solar Energy Data
Late one Friday evening in February 2022, awake in a quiet house I found myself curious about residential solar. At 10:39pm, I created an account on EnergySage.com and plugged in some basic information, and eventually went to bed. At 9:16am Saturday morning, I received my first solar quote, proposing to offset 100% of my electricity usage. I had three quotes in hand by lunch time (on a Saturday), and two more by Tuesday. Thanks to EnergySage, my first step into solar energy was so simple I barely realized I was taking it. After a few conversations with my wife and the installers, we were running on green, carbon-free electricity by the late afternoon on Tax Day, April 15.

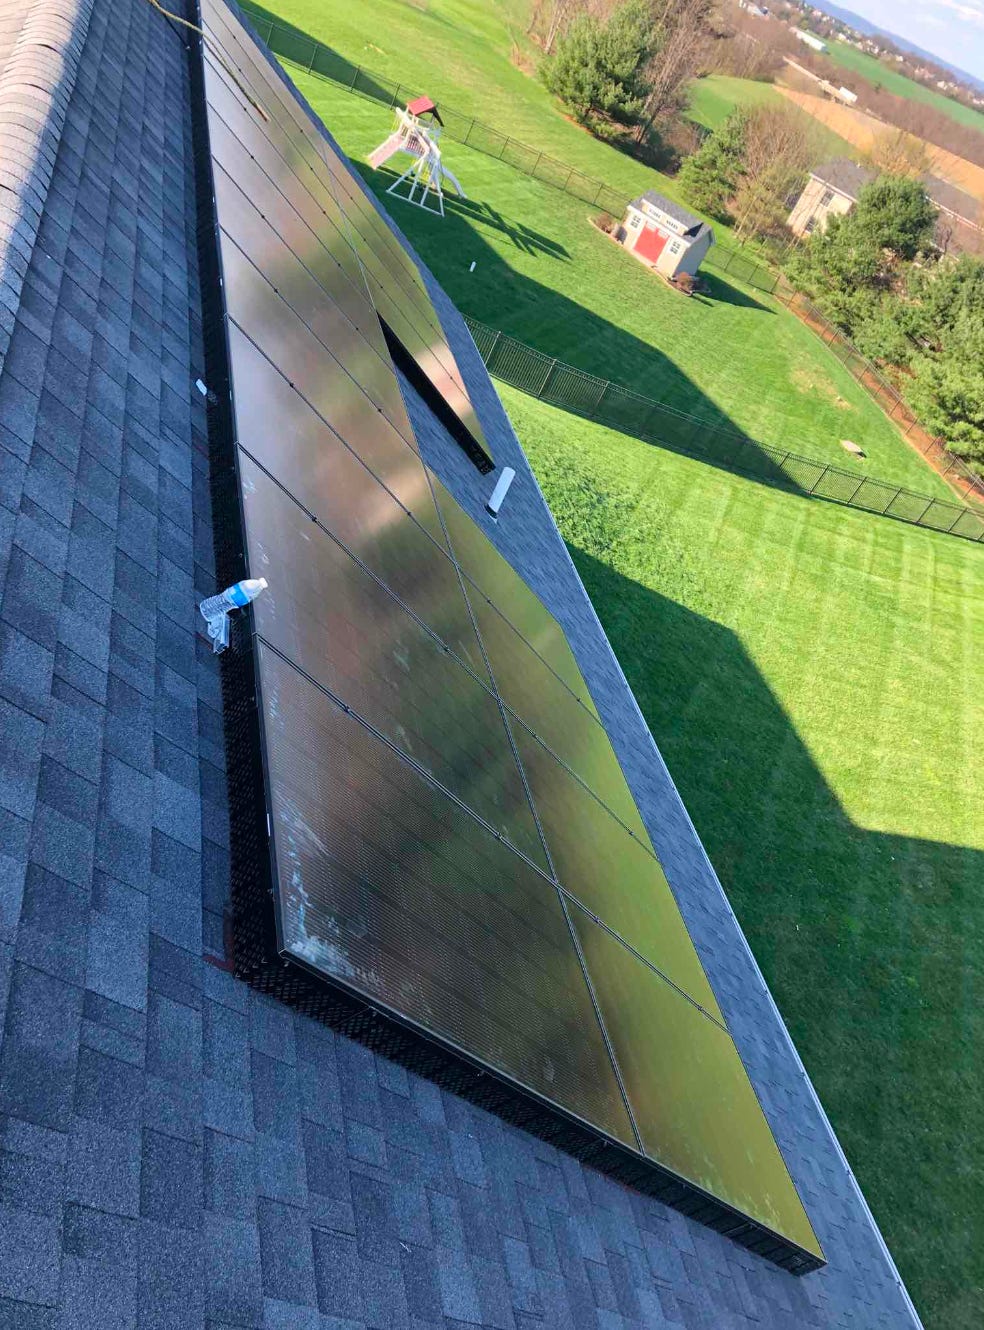
Our roof faces almost exactly east/west (azimuth angles 265 and 84), so the panels are split between the two sides, at a 34 degree tilt, to catch the sun at from dawn to dusk. We have LG panels, manufactured in my hometown of Huntsville, AL, shortly before LG shut down their solar panel manufacturing business to focus on battery production. (I wonder if they would have made the same decision had the Inflation Reduction Act and reaffirmed solar incentives passed a few months earlier???)
Energy Production
The 42 panels are rated for 370 Watts apiece for a system total of 15.5 kW. Its peak day thus far was June 19 of 2022, when it generated 106.6 kWh on a cloudless, peak sun day according to our Enphase dashboard.

Of course, not every day has been quite so productive. The 2022 winter solstice was nearly as clear, but with the shortest window of daylight for the year, the system generated just 32.5 kWh of electricity. We bottomed out a week earlier on a cloudy and rainy December 15 with a measley 0.9 kWh.
More recently, eastern PA has been visited by multiple bouts of Canadian wildfire smoke, sometimes at dangerous levels.

The solar panels felt the effects as well, producing well below capacity once the thick smoke rolled in:

Plotted over time, here’s our system’s daily production:

As expected, there’s a lot of variation day to day. However, we notice a few trends:
The center of the spread clearly follows the daylight hours very closely, peaking at the summer solstice and bottoming out at the winter solstice as previously noted.
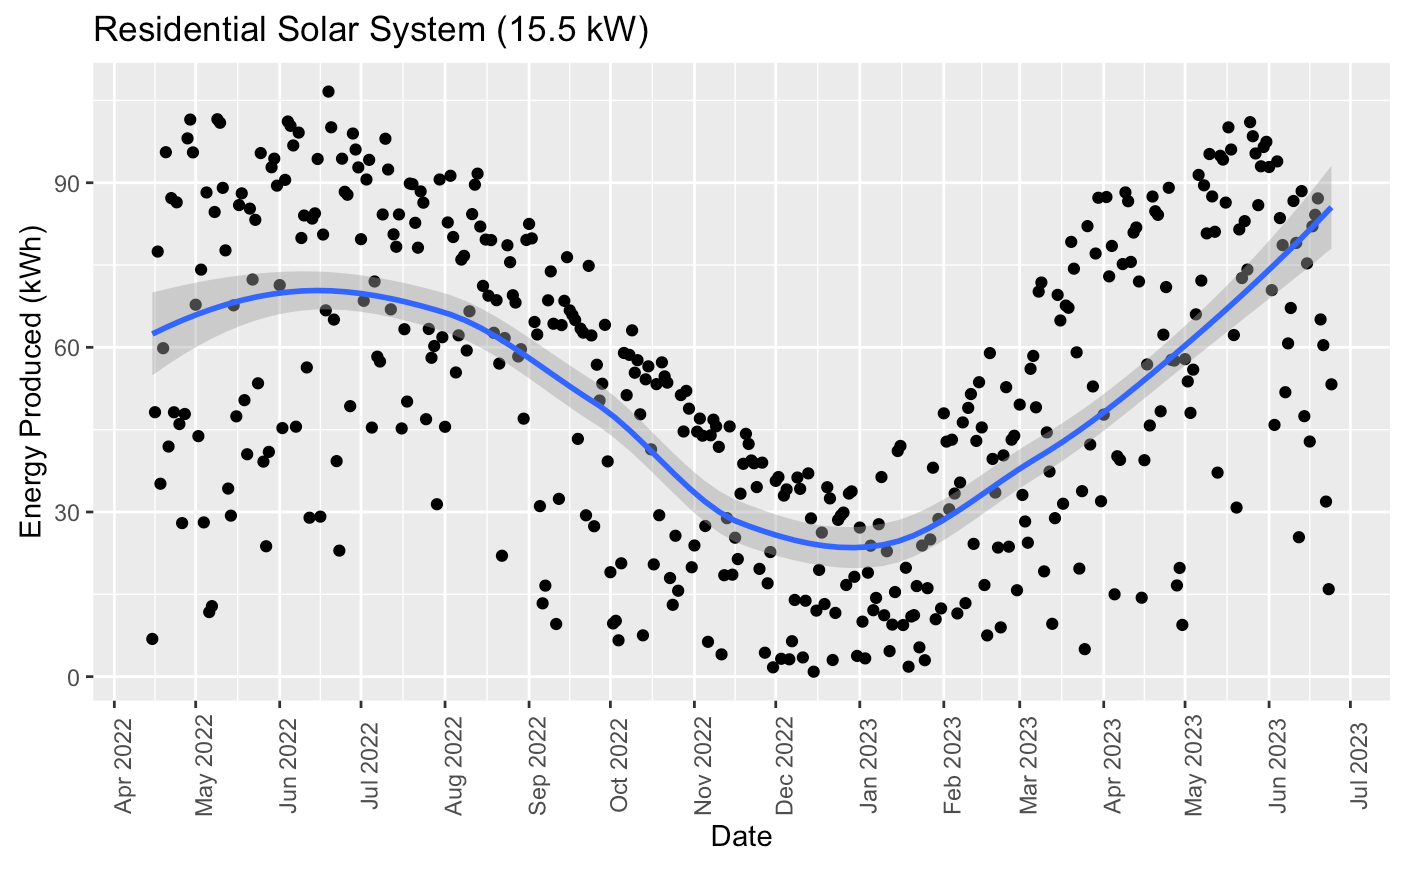
The trend can be seen most clearly when approximating the top of the distribution (i.e. the perfectly sunny days).

There does appear to be some non-linearity to it, as the spring and autumn peaks tend to poke above the line, perhaps related to the particular angles of our east/west facing arrays.
June, while typically the highest production month, has been underwhelming this year thanks to a run of (much needed) rainfall and the aforementioned smoky orange skies.


Energy Consumption
Pennsylvania Power and Light (PPL) is our electricity supplier, based right here in Allentown. They offer a fixed rate for electricity and net metering for residential solar owners, meaning the electicity generated is valued at the same price as energy consumed, regardless of the time of day it is consumed or generated.
We previously used a renewable energy supplier (Brighten Energy). However, they do not offer net metering. (States further along the solar adoption curve have embraced time-of-use electicity rates to encourage more flexible generation when the grid requires it to meet demand. )
In the 2+ weeks of April that our power was supplied directly by PPL before installing solar, our electricty usage averaged a fairly low amount of electricity throughout the day, aside from a peak at 6:30-7am ET. Can you imagine what that is?

If we average this out by 15-minute interval, this becomes:

The spike at 6am is presumably the programmable thermostat kicking on, transitioning from nighttime to daytime settings. This stretch of March into April, between when we switched back to PPL and our panels were installed, might not be typical of year round consumption.
Unfortunately, we do not have a consumption meter installed. Because the solar panels are behind the meter, PPL only knows and reports how much net energy they deliver to us and receive from us. When we are consuming energy directly from the solar panels, we don’t have a record of that from PPL.
We can look at PPL’s net energy delivered since the panels were installed. It varies quite a bit day to day, but averaging it out, we see our 6am spike quickly offset by solar production. Our net energy delivered by PPL to our house is negative from about 8am to 6pm on the average day, meaning our solar production exceeds our energy consumption for about 10 hours per day.

As mentioned, this varies a bit by time of year thanks to the changing amount of sunlight and energy consumption.

Thus we have our own personal duck curve.
Our installer projected 17,277 kWh of production in Year 1; our system actually produced 18,060 kWh. All together, our solar panels outproduced our consumption in the first 365 full days by 998.7 kWh. With our supply and distribution charges from PPL summing to 19.2 cents per kWh and their policy for payment at the same rate for excess production, this saved us nearly $3,500 in electricity charges. Add in the 30% tax credit (affirmed in the Inflation Reduction Act) and our first sales of solar renewable energy credits (SREC), and we’re ahead of the projected 10-year payback period.
I expect we will not overproduce going forward, as our electricity consumption has gone up recently. An astute observer might have picked up on some subtle changes that stick out starting in in February and March. I may expound about these in a future study.