


Carbon Reduction of Residential Solar (Part 1)
Variable Production and Consumption
It’s somewhat unintuitive that electricity represents 25% of U.S. greenhouse gas emissions, probably because the pollution is emitted at generators far out of sight from where it is consumed. Most grid electricity comes from burning fossil fuels and releasing greenhouse gases in the process. According to the National Public Utilities Council’s report on the 47 largest investor owned utilities, about a quarter (25.1%) of electricity generation is from coal and one-third (33.1%) is from “natural” gas (also known as “fossil gas” given that it’s mostly methane, which is 27-30 times more potent as a greenhouse gas than carbon dioxide, and even worse over the short term). With over a half of electricity generation coming from high-emitting sources at present, electricity consumed from the grid is polluting the atmosphere. If you’re getting electricity from your local utility, every time you plug in your phone, turn on your TV, or even charge your electric car, you’re contributing to climate change. (Granted, the electric car is still better for the climate than a gas car.)
Fortunately, there are ways to reduce to the carbon emissions of grid electricity! Going solar is a great one. In addition to the long term financial benefits, residential solar panels allow you to shift from public grid energy, powered in large part by fossil fuels, to 100% renewable energy from your own rooftop. Your panels sit there absorbing free, clean energy from the sun rather than burning fuel and polluting carbon into the atmosphere. If your panels produce as much energy as you consume, your carbon footprint is completely erased, right?
Not so fast…
It’s not quite that simple. Most solar installations, including my own, are “behind the meter” but connected to the electricity grid. The electric meter typically counts how much energy is being consumed by the house or apartment; in the case of a dwelling with behind-the-meter solar, it measures the net consumption, after subtracting the solar production. During especially sunny times, the meter might “run backwards”, meaning the house is sending electricity back to the grid rather than the other way around. At other times, when solar production is lower than electricity consumption, it’s a net consumer from the dirtier electricity sources powering the grid.
Even if your solar panels produce as much electricity as you consume over the course of the year, the production and consumption are not especially well aligned minute to minute, day to day, and month to month. Solar tends to overproduce during the day, especially during summer months, and goes to zero after sunset while the house is still near its peak energy consumption; thus, the home is a net producer of electricity during the days and summers and a net consumer during the nights and winters. This holds true at my home following the installation of solar panels.
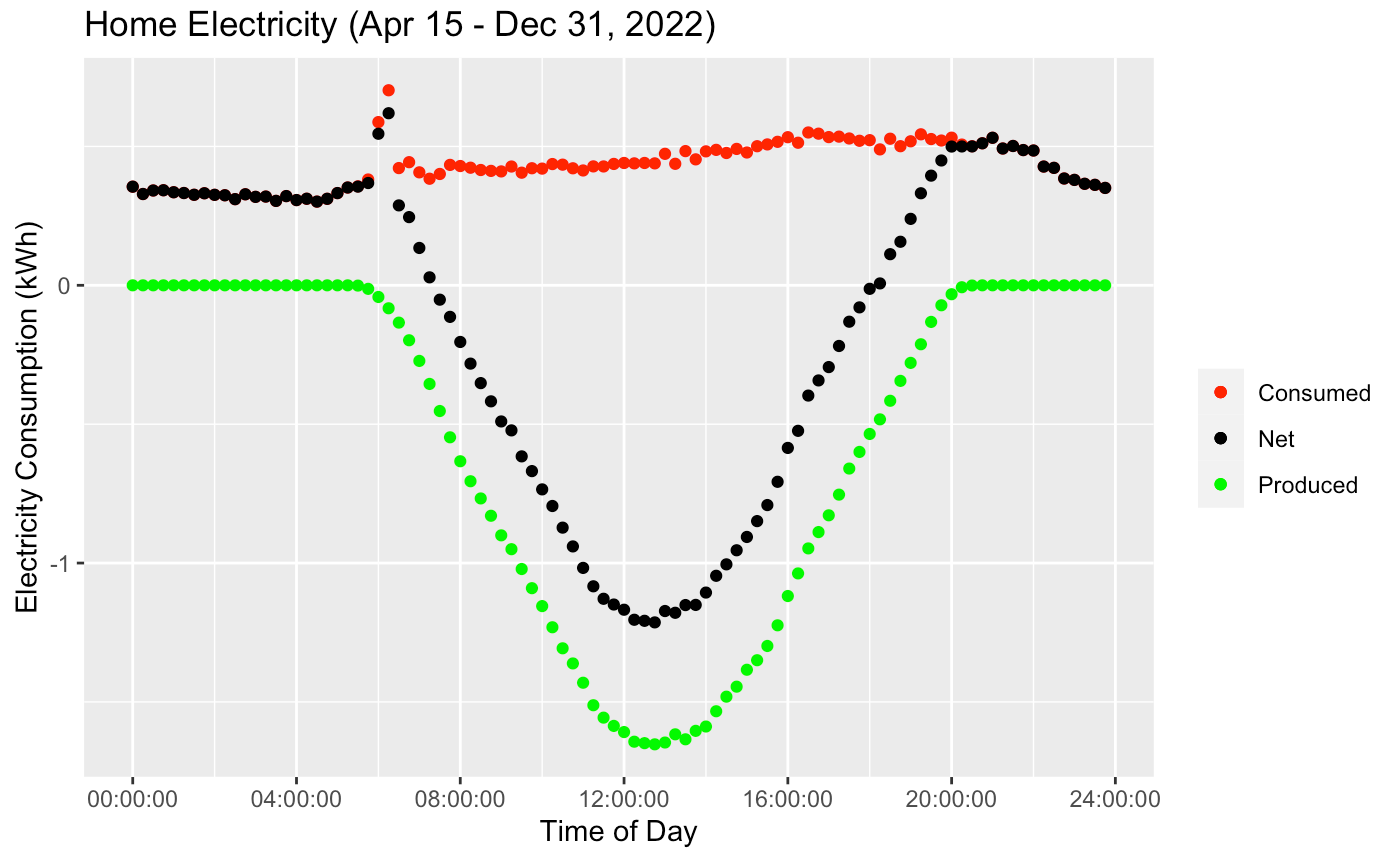
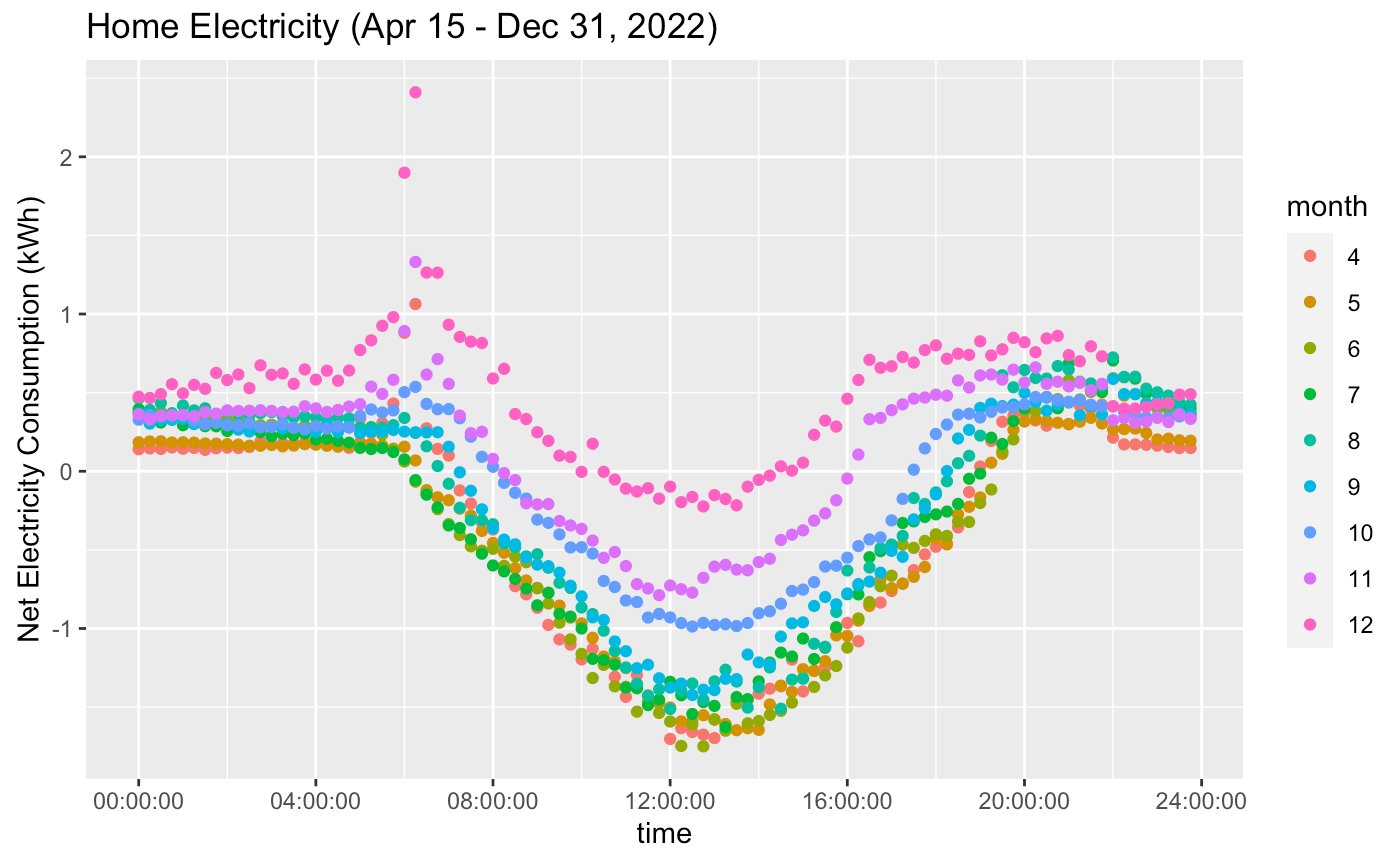
Our electricity consumption is fairly flat throughout the day, with a slow increase from early morning through early evening, a gentle plateau for the evening hours before a drop to the overnight baseline. But even though my solar panels outproduced my family’s needs in total over the first 365 days, we were only net producers of energy for only a few hours on the average December day compared to 12+ hours in the summer. The rest of the time, our house was pulling from the grid.
Grid Load & Emissions
Of course, my home is not unique in its consumption and production trends. Houses, business offices, commercial real estate, and industries all demand electricity from the grid in different patterns. The EIA shows how aggregate grid load varies by region and time of year.

By definition, electricity demand must exactly match supply. However, not every electricity generator is consistently capable of producing energy and scaling up and down with demand, especially with renewables such as wind and solar in the mix.
When cheap, renewable energy is available (and, generally speaking, they are cheaper), the grid happily consumes it and distributes it to customers. This also reduces dirtier coal and gas plants to a lower percentage of the overall electricity supply during these times, resulting in a cleaner grid. When wind and solar are not available, more fossil fuel is used to generate the electricity needed to meet demand, and the grid is dirtier.
Fortunately for data nerds like me, there’s a ton of data available through sites like GridStatus.io, Electricity Maps, and WattTime that provide real time and historical data on the composition of grid electricity.

I’ll take a break here. We’ve seen how, from my home to the grid at large, electricity demand varies by time of day and time of year. We’ve also seen how sources of electricity supply also vary, and with it the carbon intensity of the overall grid. In the next part, we’ll dive into some specific grid emissions data to estimate the true carbon impact of specific actions affecting the electricity grid, such as the installation of residential solar.