
Projecting Solar Production with Weather Data
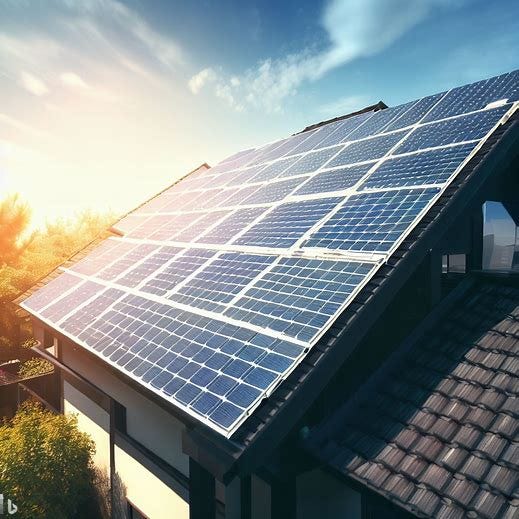
In the previous post, I recounted our first year with solar panels and the energy consumption and production data, finding that we are ahead of the original projection for a 10-year payback on our investment. Here, I seek to build on that and build a simple 15-day forecast for solar energy production.
I acquired a history of local weather data from Visual Crossing, which uses a network of weather stations to approximate the weather conditions for any given address. Here is the weather station closest to my house, for example:
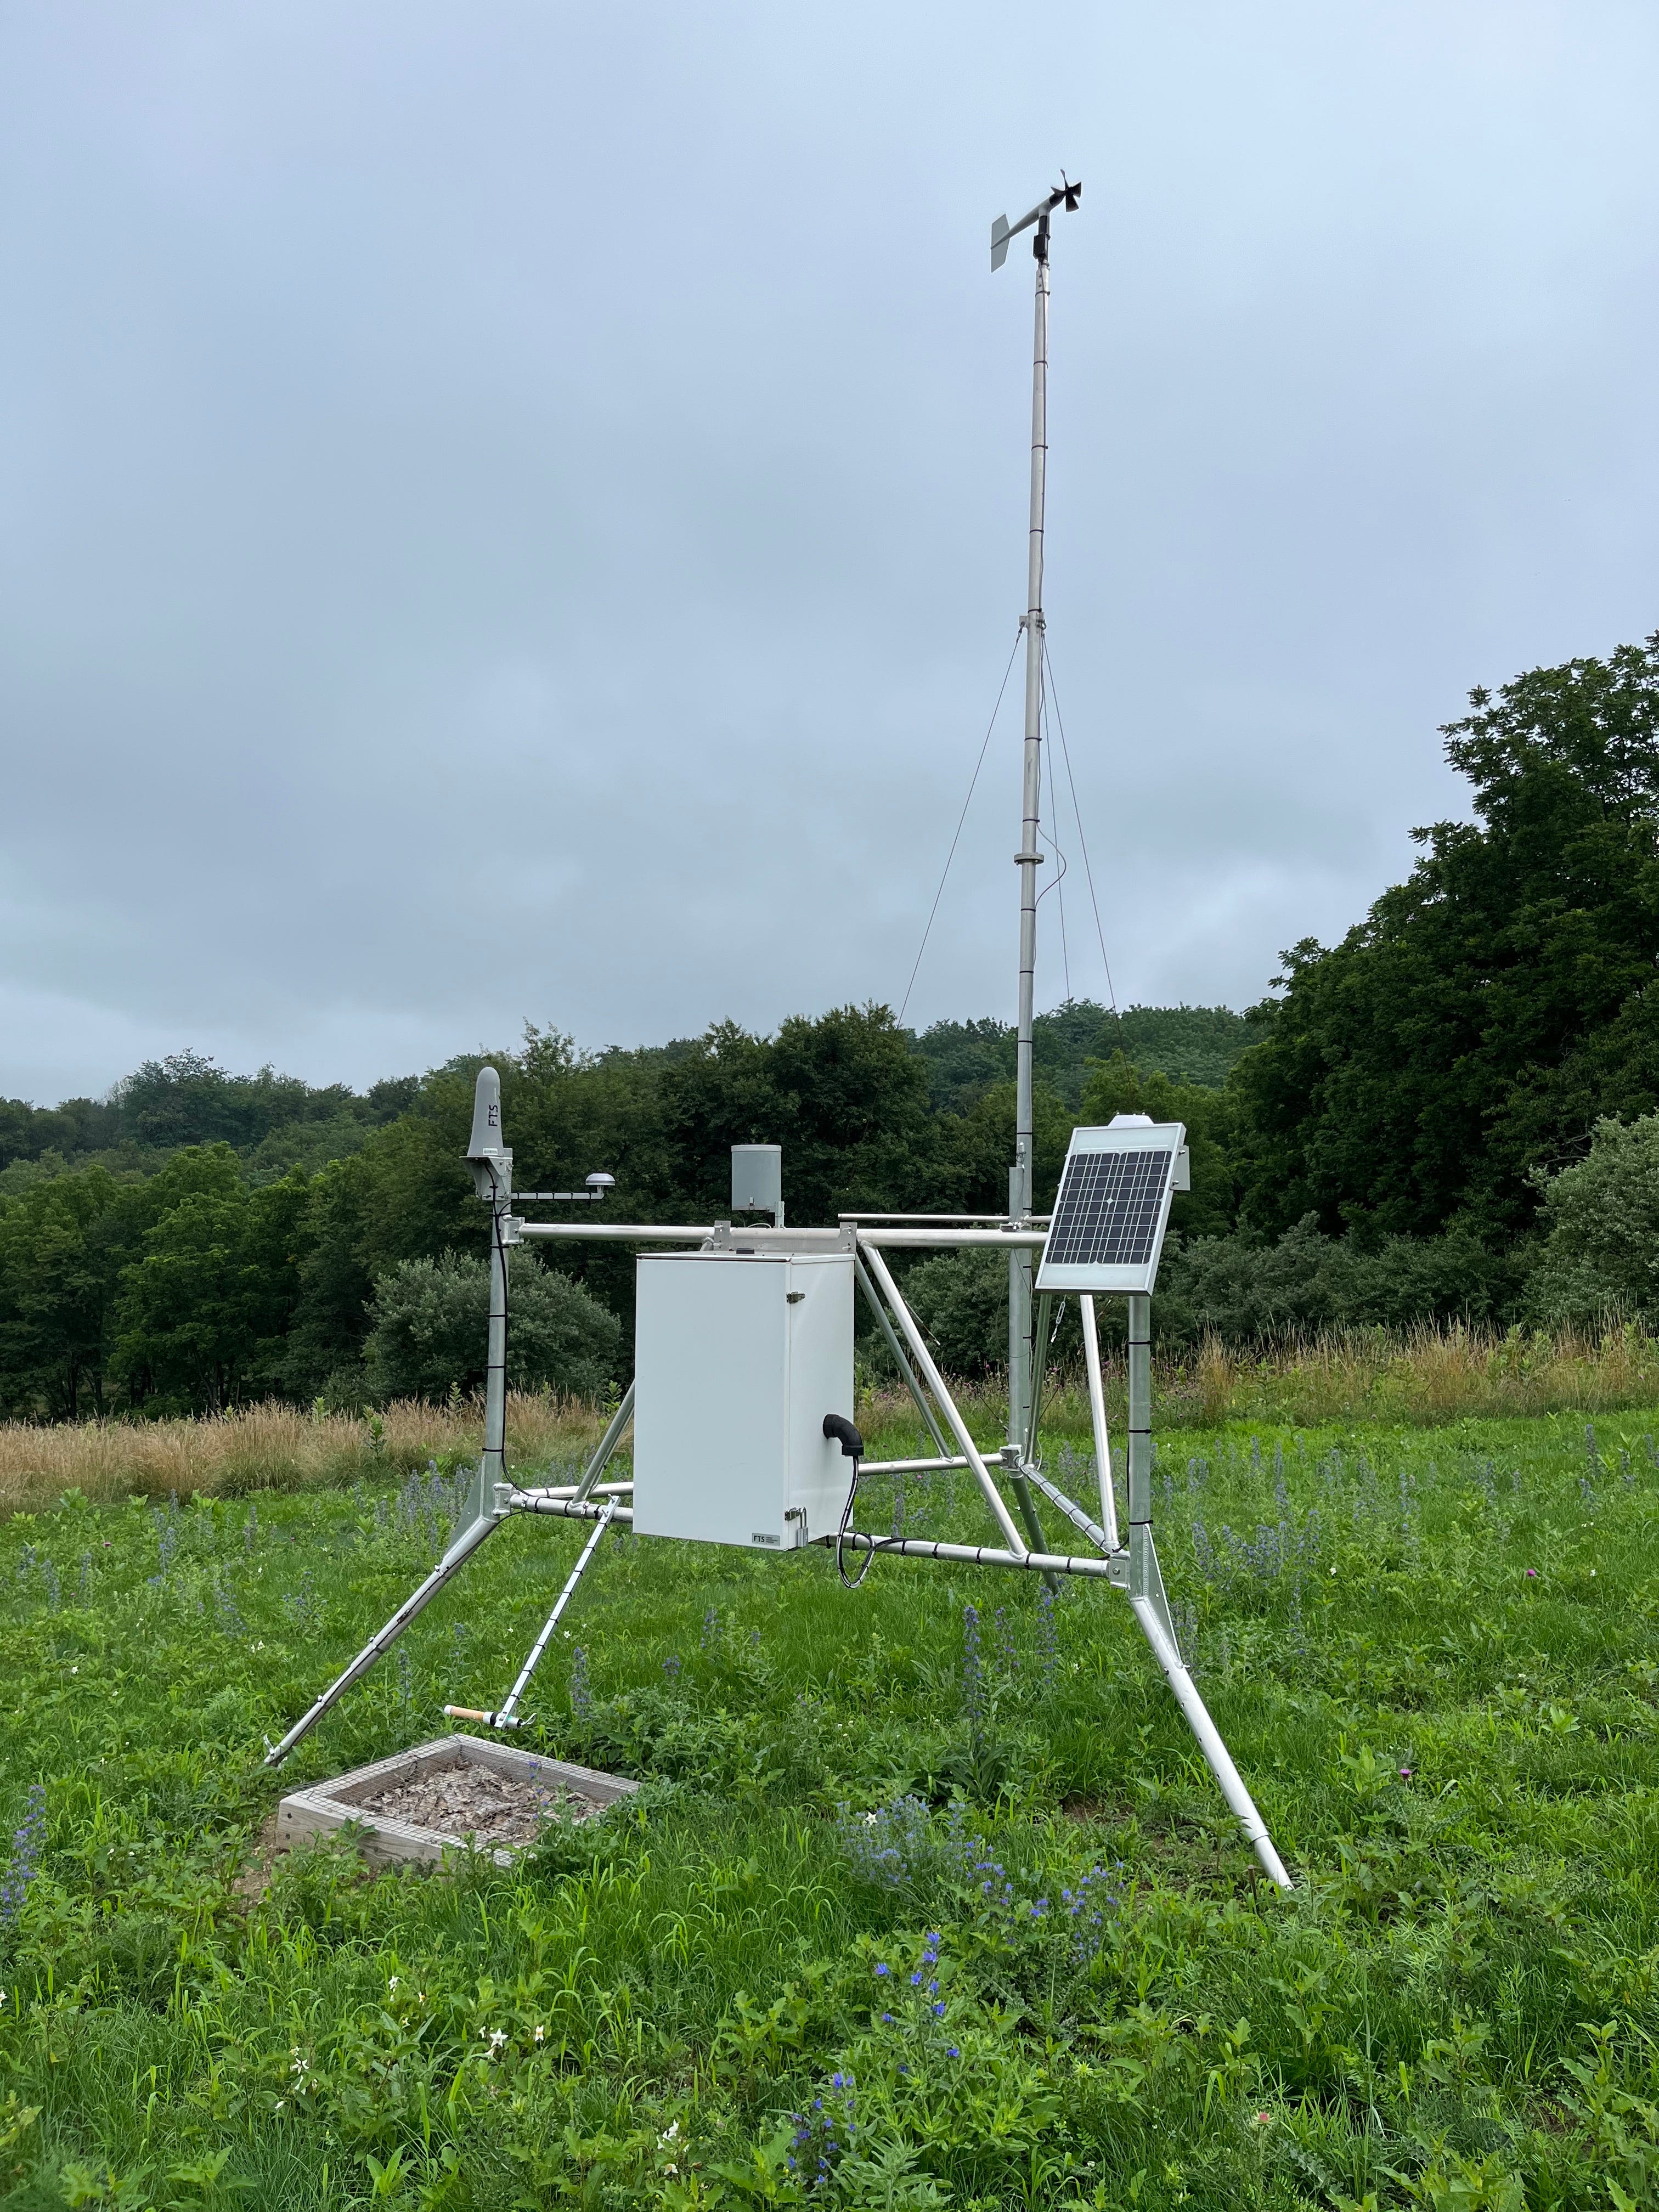
This proved to be a rich data set of not only temperature, precipitation, cloud cover, sunrise, and sunset, but also solar radiation and solar energy averages on a daily or hourly basis. The site also provides 15-day forecasts for each data point. Downloads and API calls are free up to 1,000 records per day, which is more than sufficient to grab 1.5 years of historical data corresponding to my solar production.


I aligned daily weather data with my system’s solar energy production to examine the relationships. Looking at a simple correlation, the results match our intuition. More humidity, precipitation, and clouds correlate with less solar production, while higher temperatures, greater visibility, and longer daylight tend to come on the same days with higher energy production. Most notable (if unsurprising) however is the extremely high correlation between the solar radiation and solar energy measurements and solar production:

Visual Crossing’s solar radiation and solar energy data correlate with my solar production at .975.
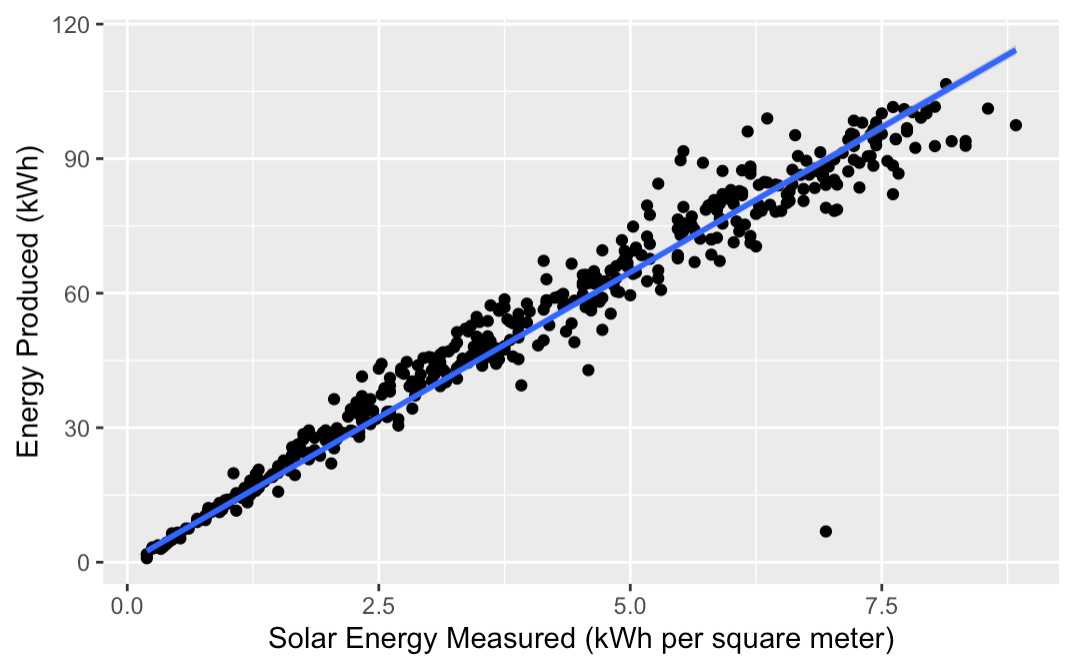
The relationship isn’t perfect: about 5% noise remains, likely at least partly from the assymetrical layout of my panels. But, the Visual Crossing data proves to be a strong indicator of our solar production on a given day.
Since Visual Crossing also provides a 15-day forecast that includes a solar energy prediction, we can use this simple linear relationship to project our solar energy production over two weeks in advance, as seen here:

Visual Crossing expects clearer skies than we’ve had in weeks, leading to some of the highest solar production totals of the year.
Of course, this projection can only be as good as its inputs. If Visual Crossing's solar energy forecast for my area proves to be off base, my projected energy production will miss the target as well.
In future, I may seek to evaluate these forecasts’ accuracy and explore ways to improve them. Grid operators are heavily dependent on similar (but presumably much more complex and accurate!) models to project electricity production minutes, hours, and days in advance. Similarly, they must model the demand for electricity, which we touched on in the previous post. We may similarly may look to pair electricity supply and demand models to explore how energy storage (batteries) and destributed energy resources (DERs) could help balance out the gaps between the two.
Note: here is the GitHub where I’m posting the code and notebooks that I’ve used to explore this data.